I am at Lehigh University again this summer continuing work on my doctorate in global educational leadership. My first class this summer session is a bit different than previous courses. Teaching and Learning with Geospatial Tools, the tools being Google Earth and Arc GIS. Maps have always been an interest of mine and is part of the reason that I decided to go into international education and travel the world. Actually going to the places I looked at in childhood is still thrilling to me.
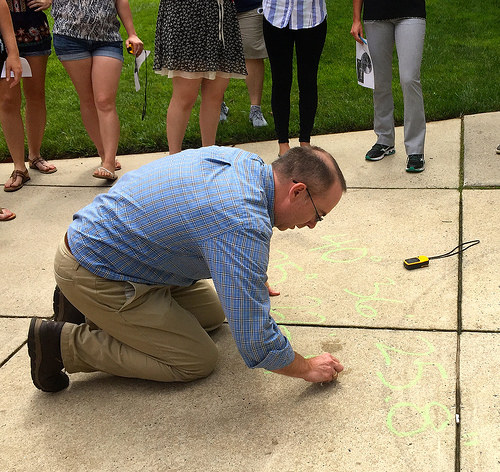
The class has been fascinating and I am very excited about the power of mapping and big data sets. I am looking for ways to use them in an educational leadership / sustainability education framework. Above, Dr. Hammond is reviewing with us on the Lehigh campus, the concepts of latitude and longitude which are the fundamental base of geospatial tools. Global Position System technology is such a powerful tool and the perfect way to visually represent and analyze data. Geospatial tools combine maps with data to show patterns and they can be used to help explain historical events, climate change, biodiversity loss, etc. Having the ability to put huge amounts of data into a clear form is powerful and possibly transformative. It fits in well with sustainability education because as a framework of solutions-based education, problems can be demonstrated more clearly through combining data with maps.
Dr. Hammond introduced the following tools/websites for us to begin exploring:
Google Earth – This software is much more powerful than the ubiquitous Google Maps found on mobile devices. I am surprised people do not use this more often after I saw all the things that are possible. The pro version is now free and that may be a sign that Google cannot make money off of it and will stop further development.
Arc GIS – This geographical information system that allows people to create and share interactive maps. Esri is the company behind the software and there is lots to explore on their website. Using this software is a bit frustrating for me because it is difficult to import data into the software due to formatting differences. I would like to do the lesson tutorials and really get good at making data-rich maps. This is such a powerful tool. I spent several hours formatting my data to make it readable for Arc GIS.
ARIS – This is a free, open-source software of augmented reality and educators can make interactive mobile device games. The recent Pokemon Go craze is based on this technology. I would like to use this for scavenger hunts for new teachers and high school / middle school / upper elementary students to our school. International schools always have newcomers and this would be a different way to orient them to the history, culture and geography of the school buildings and campus.
Other resources to use
Classcraft – Teachers can use this as a classroom management/reward system for their classes. It is based on the role-playing fantasy games like “mine craft” or “dungeons and dragons” and basically “gamifies” classrooms. It is popular in some schools.
Story Maps – Another tool of Esri that allows creators to add text, images and other items to maps that creates a very powerful teaching tool. An example of a similar program is VisualEyes, created by a professor at the University of Virginia. This link shows a project teaching Thomas Jefferson’s trip to England when he was ambassador to France.
Gapminder – An online visualization tool for statistics with a huge amount of content.
Some of the theoretical concepts touched upon in class were as follows:
map projections – 2-D maps distort the spherical earth – I believe that with Google Earth and mobile devices, 2-D maps will be a thing of the past and everything will be in 3-D. The mercator projection, the most common format of the world map has so much distortions.
GIS = maps + data / .kmz and .kml are keyhole markup language files that are the format most used in mapping. Databases are best in CSV (comma separated) format.
The US government has some great websites for data including the department of agriculture, geologic survey, census.gov, etc. I would like to make a linked list of website.
EDD Maps – an invasive species database
GPS/GIS is “cross-fit” for your brain and many types of thinking and processes occur to orient oneself
history – whiskey rebellion / civil war battles / Nazi extermination camps / John Snow cholera outbreak in London
For innovation to diffuse, need compatibility, trialability, relative advantage, observability and simplicity vs. complexity.
Why do we have seasons? The tilt of the earth causes sunlight to move through a greater distance of atmosphere in winter than summer. Light energy degrades as it moves through atmosphere, hence in winter when it reaches earth’s surface, much less energy. The big lesson for us – messing with the atmosphere (ie greenhouse gases) has huge implications for our climate!

Published by