Read this month’s issue of OIS Educator online!
News and views from the Tashkent International School Director, Bill Kralovec
We are looking for foreign students in grades 3 through 8 who would like to perform in a unique Japanese cultural activity. The Yamamoto Theatre company wants a group between 20 and 30 students to perform a Noh theatre play about Osaka in November. Noh is an ancient form of Japanese theatre that involves music, singing, dance and costumes. Please see SOISmail for more information.
Noh
Sustainable gardening practices must be the future of farming and food production. As farming resources such as rich soil are depleted, scientists have been researching new methods of growing fruits and vegetables. For example, aquaponics takes advantage of the nitrogen cycle by using fish excrement to grow plants without soil. Instead the root structure is supported in gravel. The fish supply 10 essential minerals to the plants and in turn the plants clean the water so that the fish can live in a healthy environment. At OIS we have been running an ebb and flow system since last spring. Every two hours water is pumped up from the fish tank into the grow beds and returned to the fish tank via a bell siphon. A bell siphon creates a vacuum where the water is sucked out of the grow bed thus pulling air from the surface to the roots. This heavily oxygenated environment supplies nutrients right to the plants yielding faster growth and using just 5% of the water of traditional farming methods.

OIS has been running an aquaponics system on the second floor balcony since last spring. It is home to over a dozen fish and several vegetables including peppers, celery, lettuce and many others. Please visit this living science experiment to peek into the future of farming. Encourage your children to become involved with maintaining and expanding our aquaponics system by joining the Aquaponics Club, see Mr. Van Plantinga Room 344.

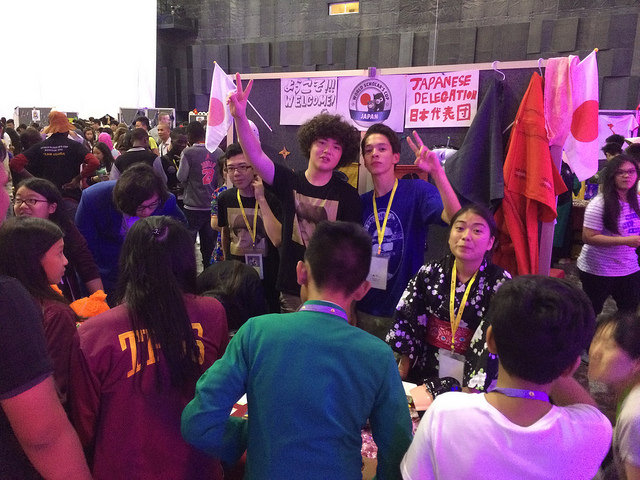
24 OIS students participated in the World Scholar’s Cup (WSC) Global Round 2016 in Bangkok, Thailand this past June. Close to 3,500 students from around the world were placed in two age divisions and competed in academic events debate, knowledge bowl, collaborative writing, etc. Students teams of three were formed and although the emphasis was on academic competition, there were also many team-building and collaborative activities. The students made a lot of friends and thoroughly enjoyed themselves for the five-day event.
In January, the year’s theme is revealed on the World Scholar’s Cup website (http://www.scholarscup.org/) and students are provided with resources to guide their study. Students then compete in a regional round. SOIS hosted the Kansai round in May.Teams qualified for the Global Round in June based on their results in the regional round. In addition to the OIS students, 13 SIS students also participated in the Global Round. The students said the resources chosen by WSC were relevant to their OIS classes and were at a very high academic level. It sparked interests for many of them in different topics. The events like debate, also gave them self confidence to present themselves and make logical arguments to convince the judges. Participants this year explored the complexities of the theme “An Imperfect World”. One topic that especially challenged them was to take the against stance on the goal that nations should provide free health care for their citizens. Topics for the collaborative writing included “Machiavelli would approve of modern world leaders” and “The woman in the art work, The Wait should give up” among others.
Skye Inada, Tyus Sheriff and Lilian Tsubaki placed 6th overall in the Junior Division (ages 10-14) that had over 500 teams and over 1,800 students. They finished second in the East Asia (China, Japan, Korea, Taiwan) group. They also earned a fifth place trophy for their finish in the individual “challenge” round, a written test. Noah Izumi, Nanami Hasegawa and Minami Matsushima finished in 36th place. Several other teams qualified for the Tournament of Champions taking place on the campus of Yale University in New Haven, Connecticut in November. Other members of the OIS delegation included Antonio Kogata, Lisa Yokoe, Hun Jong Ha, Ouka Maeda, Owen Kralovec, Eun Lewis, Sana Konishi, Malka Bobove, Emily Yoo, Virginia Hwang, Rena Kawasaki, Ayana Nakamae, Maurice Tokai, Sho Sakura and Irina Setoyama. SIS students attending were Kikka Okuda, Satoi Akeda, Sophia Smith, Mio Kodama, Mizuki Ito, Natsumi Kato, Chisato Suga, Shuri Kozu, Yuka Nakayama, Amy Skerly, Miki Fujito and Fumina Nakamae. Sophia Smith finished 8th place overall in debate. Congratulations to all the students for their hard work and representing the schools so well.
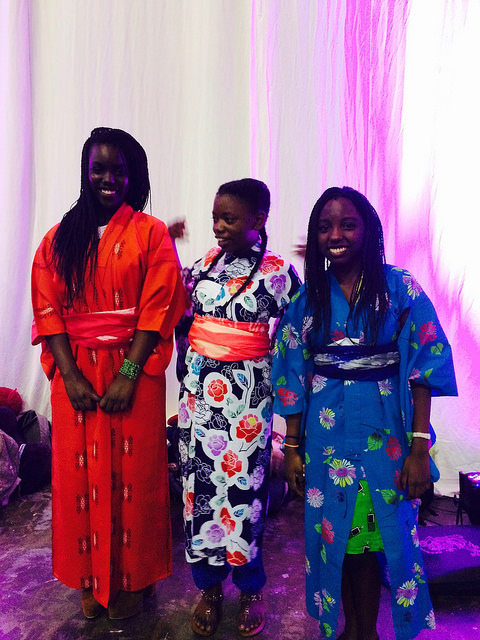
They made friends from all around the world!
It took a lot of time from the faculties to make this event happen. Thanks go to Dawn Inada, Yuka Nakanishi, Steven Sheriff and Kaori Minakuchi among others.
The 2017 Kansai Round will once again be hosted by SOIS, April 29-30. We are looking forward to the continued growth of the program here at SOIS.

The Senri & Osaka International Schools of Kwansei Gakuin will be hosting Literacy for learning: International edition tutor training program on October 31 – November 3, 2016. The program is produced by the Department of Education and Child Development (DECD) in Adelaide, Australia and is one of a suite of professional development programs developed by DECD under the name, Unlocking the World: Professional Development for Teachers.
You may be familiar with the Teaching ESL Students in the Mainstream course (TESMC) also developed by DECD. The Literacy for Learning (LfL) course is similar to TESMC, without any ESL references, contains many new texts and activities and is focused on literacy. It is 7 hours shorter and while TESMC is for teachers new to working with ESL students, LfL is for teachers who are very familiar with working with ESL students and their needs.
For more information on training program, please visit
http://www.unlockingtheworld.com/programs/literacy-for-learning-international-edition
Successful graduates become resident school-based tutors who deliver the Teacher Development Course. This provides your school with cost effective, school-managed professional development. The cost of the Tutor Training is AUD$3,380. You can register for the course online at
I’ve been intrigued for several years in the idea of applying “big data” and analytics to the field of education. I’ve seen the power of statistics in sports, city government, transportation, policing, etc. I recently completed Data-driven Decision Making, a course taught by Dr. Craig Hochbein and Abby Mahone at Lehigh University. It is part of my doctoral program at the school.
Dr. Hochbein challenges much of conventional/traditional thinking of schools and he made me and many of us in the class, reconsider what we take for granted in education. Craig referred to the movie Moneyball often during the course. The movie portrays Oakland Athletics general manager Billy Beane, the first to use advanced metrics in baseball to find players overlooked by the bigger teams. The A’s did not have a fair playing field against teams with larger payrolls and needed to find ways to compete with a smaller payroll. He did so by using statistics to find players that were undervalued by other teams. The same is true for many of our schools, we need to find ways to overcome the handicaps of our various situations.
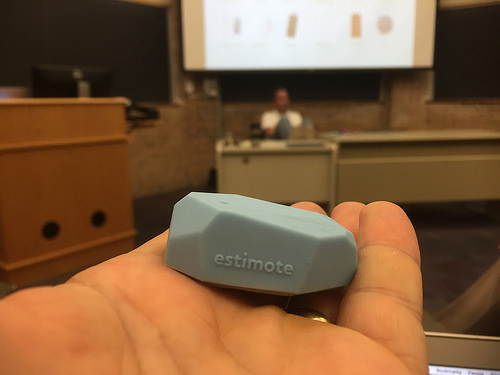
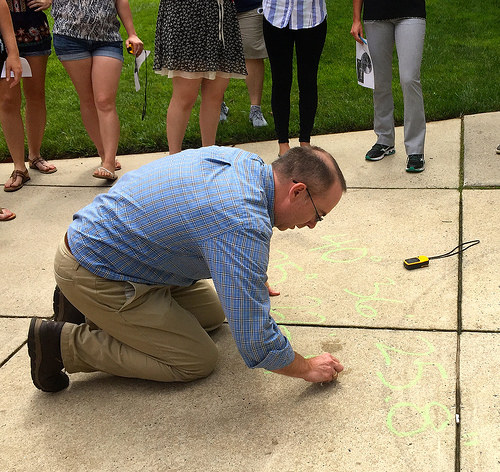
The challenge for school leaders is collecting data. Unlike baseball, every action is not tracked. The class renewed my enthusiasm for collecting more data. Besides digging deeper in the school archives for test scores, one can use technology to help. Above is a sensor that takes in location data. For example, as a school leader, I can see how much time I am in my office, when it may be better to be visible in the school. WiFi access points can also be used to track if you have an iPhone. There are even sensors that track if one is sitting or standing or breathing rate to measure activity amounts or stress.
The major project was a balanced scorecard which emphasizes finding evidence and asking the right questions and making sure the data you are collecting is answering the most important question. Below are my notes from the class.
I am at Lehigh University again this summer continuing work on my doctorate in global educational leadership. My first class this summer session is a bit different than previous courses. Teaching and Learning with Geospatial Tools, the tools being Google Earth and Arc GIS. Maps have always been an interest of mine and is part of the reason that I decided to go into international education and travel the world. Actually going to the places I looked at in childhood is still thrilling to me.
The class has been fascinating and I am very excited about the power of mapping and big data sets. I am looking for ways to use them in an educational leadership / sustainability education framework. Above, Dr. Hammond is reviewing with us on the Lehigh campus, the concepts of latitude and longitude which are the fundamental base of geospatial tools. Global Position System technology is such a powerful tool and the perfect way to visually represent and analyze data. Geospatial tools combine maps with data to show patterns and they can be used to help explain historical events, climate change, biodiversity loss, etc. Having the ability to put huge amounts of data into a clear form is powerful and possibly transformative. It fits in well with sustainability education because as a framework of solutions-based education, problems can be demonstrated more clearly through combining data with maps.
Dr. Hammond introduced the following tools/websites for us to begin exploring:
Google Earth – This software is much more powerful than the ubiquitous Google Maps found on mobile devices. I am surprised people do not use this more often after I saw all the things that are possible. The pro version is now free and that may be a sign that Google cannot make money off of it and will stop further development.
Arc GIS – This geographical information system that allows people to create and share interactive maps. Esri is the company behind the software and there is lots to explore on their website. Using this software is a bit frustrating for me because it is difficult to import data into the software due to formatting differences. I would like to do the lesson tutorials and really get good at making data-rich maps. This is such a powerful tool. I spent several hours formatting my data to make it readable for Arc GIS.
ARIS – This is a free, open-source software of augmented reality and educators can make interactive mobile device games. The recent Pokemon Go craze is based on this technology. I would like to use this for scavenger hunts for new teachers and high school / middle school / upper elementary students to our school. International schools always have newcomers and this would be a different way to orient them to the history, culture and geography of the school buildings and campus.
Other resources to use
Classcraft – Teachers can use this as a classroom management/reward system for their classes. It is based on the role-playing fantasy games like “mine craft” or “dungeons and dragons” and basically “gamifies” classrooms. It is popular in some schools.
Story Maps – Another tool of Esri that allows creators to add text, images and other items to maps that creates a very powerful teaching tool. An example of a similar program is VisualEyes, created by a professor at the University of Virginia. This link shows a project teaching Thomas Jefferson’s trip to England when he was ambassador to France.
Gapminder – An online visualization tool for statistics with a huge amount of content.
Some of the theoretical concepts touched upon in class were as follows:
map projections – 2-D maps distort the spherical earth – I believe that with Google Earth and mobile devices, 2-D maps will be a thing of the past and everything will be in 3-D. The mercator projection, the most common format of the world map has so much distortions.
GIS = maps + data / .kmz and .kml are keyhole markup language files that are the format most used in mapping. Databases are best in CSV (comma separated) format.
The US government has some great websites for data including the department of agriculture, geologic survey, census.gov, etc. I would like to make a linked list of website.
EDD Maps – an invasive species database
GPS/GIS is “cross-fit” for your brain and many types of thinking and processes occur to orient oneself
history – whiskey rebellion / civil war battles / Nazi extermination camps / John Snow cholera outbreak in London
For innovation to diffuse, need compatibility, trialability, relative advantage, observability and simplicity vs. complexity.
Why do we have seasons? The tilt of the earth causes sunlight to move through a greater distance of atmosphere in winter than summer. Light energy degrades as it moves through atmosphere, hence in winter when it reaches earth’s surface, much less energy. The big lesson for us – messing with the atmosphere (ie greenhouse gases) has huge implications for our climate!
You can read the latest issue of Tango the student newspaper and literary magazine of the Osaka International School. This issue has a “scoop” on next year’s All School Production and lots of good stories, news and information.
Link to OIS head’s study podcast page.
OIS mathematics teacher Kevin Bertman and I talk about teaching programming in his mathematics classes in the podcast above. Coding or computer programming is increasingly being offered in schools today and there are initiatives throughout the world to make it mandatory. With computers taking over many aspects of our daily work, a knowledge of programming and the logic behind it are important for students to be exposed to. In this podcast we talk about coding, mathematics teaching, the different levels of mathematics in the IB, driverless cars and other topics. Thanks to Mr. Bertman for sharing with us his passion for programming and on behalf of the community, thanks to him for bringing it to our curriculum.
MrBertman.com is Kevin’s professional website.
Codecademy is a free website that you can teach yourself coding.
Scratch is a free programming language created by MIT that is a great introduction to coding for all ages.
Sketch Up is a 3D computer aided drawing program.
To download Kevin’s apps from the iTunes store, please go to this link.
